Multi-decadal Atmospheric Modeling for Europe Yields Multi-purpose Data
by Frauke Feser, Ralf Weisse and Hans von Storch
Institute for Coastal Research, GKSS Research Centre
21502 Geesthacht, Germany
Regional atmospheric models have matured in the past few years. They now find broad applications that range from process studies, reconstruction of recent and paleoclimates, simulation of pathways and deposition of anthropogenic matter, construction of plausible scenarios of future climate change, and regional weather analysis. The initial major problem-- namely, the ill-posed boundary value problem--has been efficiently fixed by including a sponge zone that ensures the consistency of the interior flow with the boundary conditions at the outflow boundaries, or by introducing large-scale control in the interior. With these setups, regional models may now be integrated stably over many decades and thereby provide information on spatial and temporal scales not sufficiently resolved by present-day global climate models and weather analyses.
A first state-of-the-art regional integration, using National Centers for Environmental Prediction (NCEP) re-analysis data for reconstructing the weather details in Europe from 1958 to 1997, has now been completed. To our knowledge, this multi-decadal regional climate simulation is the longest available to date. This regional atmospheric simulation constitutes a valuable data set because of the availability of values from 1958 onwards and the high spatial and high temporal resolution of an hourly output. The model data output includes those variables most commonly required by ocean, wave, and environmental system models. A first survey shows encouraging results pointing to relevant added informational value over the coarse grid driving NCEP re-analyses. Further analysis and tests in applications are needed, and the research community is invited to use the simulation data.
The atmospheric temporal and spatial high-resolution wind and precipitation fields obtained from this simulation are currently used as input data for a number of projects. One such application includes a particle transport model examining the European lead transport and deposition during the last 40 years and the reconstruction of waves and water levels in European coastal seas. It also serves as input for a sea-level animation and currents simulation in the North Sea, and for the reconstruction of storm events in the German Bight. The data set will also be used to simulate particle dispersion with a high-resolution chemistry transport model. Further potential applications might range from the nesting of mesoscale models to the driving of high-resolution ocean, wave, or environmental models.
The Multi-decadal Regional Model Run
The 40-year run was performed using the regional atmospheric climate model
REMO (REgional MOdel) [Jacob and Podzun, 1997], that is based on the numerical weather prediction model EM of the German Weather Forecast Service (DWD). It was driven by the National Centers for Environmental Prediction (NCEP) re-analyses [Kalnay et al., 1996] at the lateral boundaries. In addition to this conventional approach, a spectral nudging technique [von Storch et al., 2000] was applied to the entire model domain. It keeps the model solution close to the NCEP re-analyses at large scales (> 750 km), for which we have the highest confidence in the quality of the forcing, while regional features may evolve independently from the forcing. This is achieved by adding nudging terms in the spectral domain with maximum strengths for small wave numbers and higher model levels.We chose to perform a continuous simulation to reduce spin-up problems to an acceptable minimum. The model operates on a rotated spherical grid with a horizontal resolution of 0.5o which corresponds to about 47 - 55 km in the zonal direction and 55 km in the meridional direction. The full model output is stored hourly.
In the following we illustrate some results. Here, emphasis is placed on the low-level wind and precipitation fields that directly affect the deposition and concentration rates of atmospheric substances, as well as near-coastal waves and water levels. Model results are presented in comparison with observational data and with global re-analyses fields of the European Centre for Medium-Range Weather Forecasts (ECMWF). Preliminary results indicate that the model succeeds in reproducing the atmospheric state for the last 40 years at a high spatial and temporal resolution.
Results
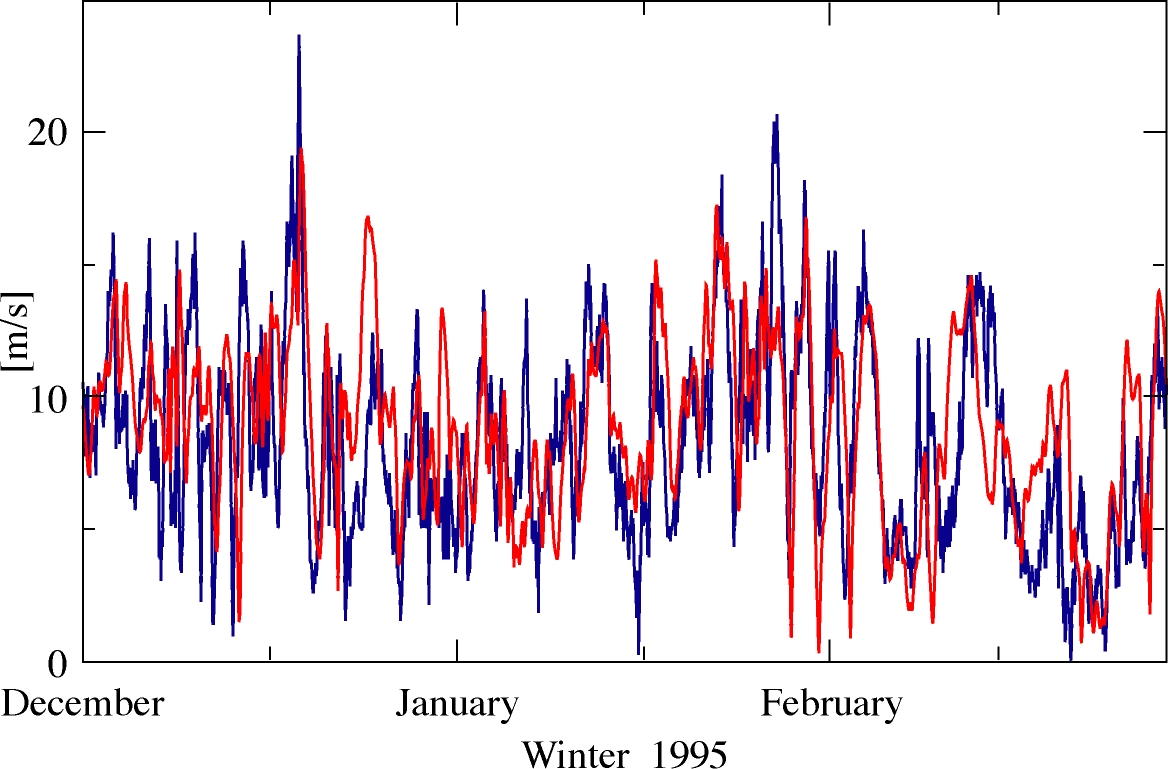
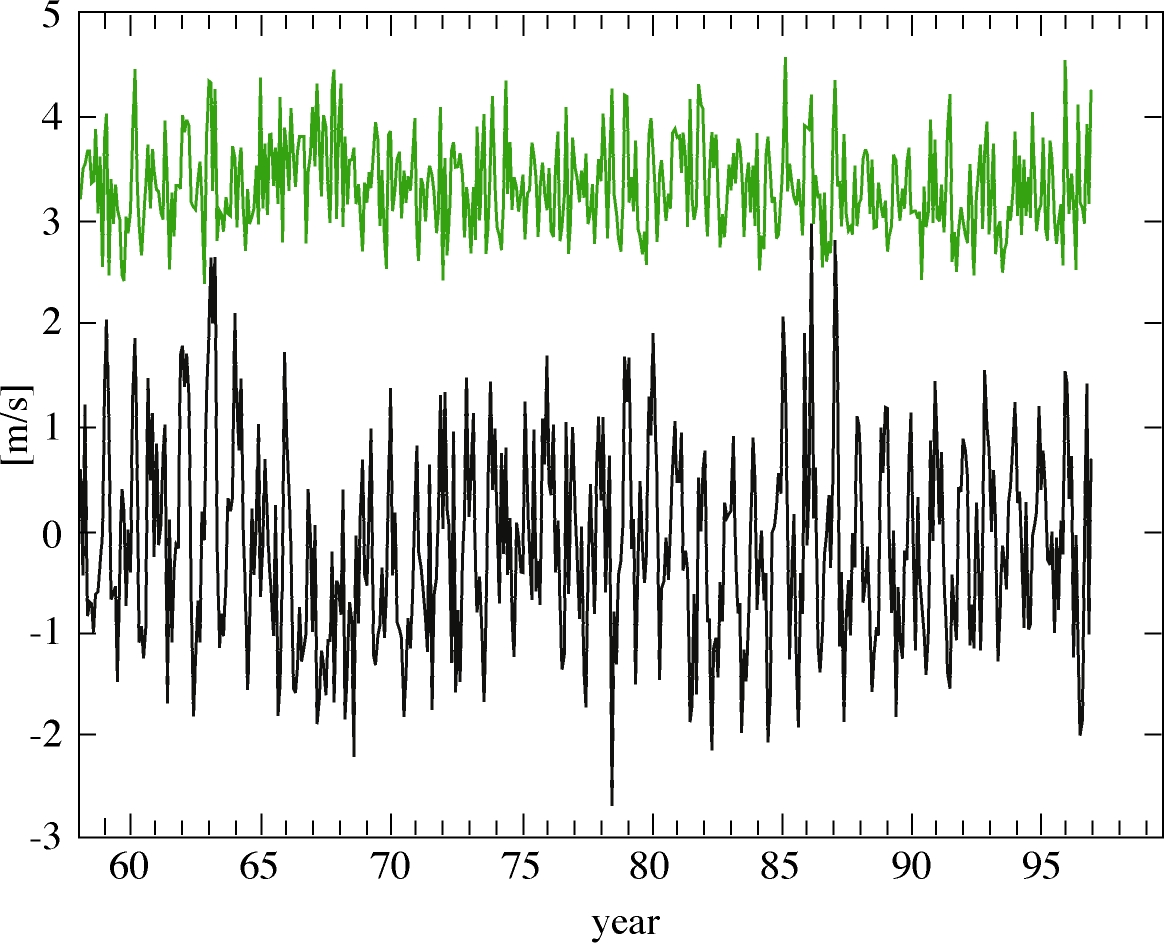
We compared near-surface wind fields at selected stations with observations. As a first example, the modeled and observed wind speeds at 10-m height for winter 1995 are displayed in Figure 1 (top) for the station List, which is located on the near-coastal island Sylt in the German Bight. The main structure of the fluctuations is well reproduced, though some of the larger peaks--for instance, those of December 18 or January 28--cannot be seen in the model run. Figure 1 (bottom) shows monthly biases and root-mean-square errors (rmse) of the modeled wind speed at 10-m height in regard to the observed wind speed at 10-m height between 1958 and 1996. The bias shows a distinct annual cycle and a slight tendency toward smaller values at the end of the simulation period. Overall, the true wind conditions are reproduced by the model with a typical bias ranging from -1.5 to +1 m/s and an average rmse of 3.5 m/s. This station is representative of the stations considered in the German Bight, though at most stations the model shows an underestimation of the true wind conditions rather than overestimated values. At offshore stations, the rmse and bias are generally much smaller than those at the coastal stations.
A simple precipitation statistic was calculated for Spain. For the time period from 1979 to 1992, ECMWF reanalysis daily rainfall data [ECMWF, 1997] were available. To achieve a better comparison with the ECMWF re-analyses, squares of 4 x 4 regional model grid boxes of 50 x 50 km were selected to match the area of the 200 x 200-km global grid boxes (see Table 1). At least two observational stations are included in each selected 200 x 200-km grid box, and their values are averaged for better comparison with the model data that represent a spatial mean over the grid box. The principal diagonal in Table 1 shows the number of events for which both the observations and the simulation are either wet or dry, while the off-diagonal gives the number of disagreeing events.
Table 1
|
Precipitation events |
Obs. wet [%] |
Obs. dry [%] |
REMO total [%] |
|
REMO wet (4 x 4 grid boxes) |
29 |
33 |
62 |
|
REMO dry (4 x 4 grid boxes) |
2 |
36 |
38 |
|
Obs. total |
31 |
69 |
100 |
|
Precipitation events |
Obs. wet [%] |
Obs. dry [%] |
ECMWF total [%] |
|
ECMWF wet |
27 |
41 |
68 |
|
ECMWF dry |
4 |
28 |
32 |
|
Obs. total |
31 |
69 |
100 |
A main drawback of the simulation appears to be that it produces too many wet events when in fact, the observations show no precipitation. However, with only a few stations in a 200 x 200-km area, it is likely that local convective precipitation might occur without being sampled by the observations. Both models, therefore, overestimate the number of rain days. But some differences still may be seen in the ratio of wet and dry days between both models. The global re-analyses are slightly worse in reproducing the observed rain days as the regional model, but they underestimate the dry days to a greater extent.
Even though we cannot conclude that a significant improvement was made in the daily precipitation amounts, the results of both models are comparable in quality. Overall, the high-resolution model is successful in reproducing the observed states within an acceptable range of errors. Although the overall accuracy is comparable to the ECMWF re-analyses, the high-resolution model provides a much longer record with higher spatial and temporal resolution. The long-term simulation has proven its numerical stability without showing any indications of "drifting" values. The numerous applications of this data set so far show reasonable results.
The data set is freely available for further scientific study. It is currently being included into the Climate and Environmental Data Retrieval and Archive (CERA) of the German climate calculation center (DKRZ):
http://cera-www.dkrz.de/CERA/index.html
 - WWW-Gateway for data download.
Acknowledgements
We thank Daniela Jacob and Ralf Podzun for their help with the model, Arno Hellbach for helping us access the NCEP data, Lennart Bengtsson for permission to use the model, and Eduardo Zorita for the observational precipitation data for Spain. We also thank the European Centre for Medium-Range Weather Forecasts for making the ECMWF re-analysis sample data available.
References
ECMWF, 1997
The Description of the ECMWF Re-analysis Global Atmospheric Data Archive.
European Centre for Medium-Range Weather Forecasts, Reading, UK.
Jacob, D., and R. Podzun, 1997
Sensitivity studies with the regional climate model REMO. Meteorol. Atmos. Phys. 63, 119-129
Kalnay, E., M. Kanamitsu, R. Kistler, W. Collins, D. Deaven, L. Gandin, M. Iredell, S. Saha, G. White, J. Woollen, Y. Zhu, M. Chelliah, W. Ebisuzaki, W. Higgins, J. Janowiak, K.C. Mo, C. Ropelewski, J. Wang, A. Leetmaa, R. Reynolds, R. Jenne, and D. Joseph, 1996
The NCEP/NCAR 40-Year Reanalysis Project. Bull. Am. Meteorol. Soc. 77, 437-471
von Storch, H., H. Langenberg and F. Feser, 2000
A Spectral Nudging Technique for Dynamical Downscaling Purposes. Mon. Weather Rev. 128, No. 10, 3664-3673